My Message
 Suggestions


The impedance and loss of the PCB is critical to the transmission of high speed signals, involving a range of factors as previously described. In order to analyze such a complex transmission channel, we can study its influence on the signal by transmitting the channel impulse response. The impulse response of the circuit can be obtained by transmitting a narrow pulse. The ideal narrow pulse should be a narrow pulse of infinitely narrow width and very high amplitude.
When this narrow pulse is transmitted along the transmission line, the pulse will be broadened, and the shape after broadening is related to the response of the line. Mathematically, we can convolve the impulse response of the channel with the input signal to obtain the waveform of the signal after transmission through the channel. The impulse response can also be obtained by the step response of the channel. Since the differential of the step response is the impulse response, the two are equivalent.
It seems that we have found a way to solve the problem, but in the real world, the ideal narrow pulse or infinite steep step signal does not exist, not only difficult to produce but also poorly controlled, so in the actual test more. The ground is tested using a sine wave to obtain a frequency domain response, and the time domain response is obtained by the corresponding physical layer test system software. Sine waves are easier to generate than other signals, and their frequency and amplitude accuracy are easier to control.
Vector network analyzer (VNA) can accurately measure the reflection and transmission characteristics of transmission channels to different frequencies by sine wave sweeping in the frequency range up to several tens of GHz. The dynamic range is more than 100dB, so modern is in progress. In the analysis of high-speed transmission channels, vector network analyzers are mainly used for measurement.
The reflection and transmission characteristics of the system under test for sine waves of different frequencies can be represented by S-parameters, which describe the characteristics of the transmission and reflection of the sine wave of the DUT for different frequencies. If we can get the reflection and transmission characteristics of the transmission channel for sine waves of different frequencies, theoretically we can predict the effect of the real digital signal after passing through this transmission channel, because the real digital signal can be considered in the frequency domain. A number of sine waves of different frequencies are formed.
For a single-ended transmission line, it contains four S-parameters: S11, S22, S21, S12. S11 and S22 reflect the reflection characteristics of sine waves of different frequencies for 1 port and 2 port respectively, S21 reflects the transmission characteristics of sine waves of different frequencies from 1 port to 2 ports, and S12 reflects the port characteristics from 2 ports to 1 port.
The transmission characteristics of sine waves of different frequencies. For the differential transmission line, since there are 4 ports in total, the S parameters are more complicated, and there are 16 in total. In general, a differential network transmission line is measured using a vector network analyzer of 4 ports or more to obtain its S parameters.

If the 16 S-parameters of the measured differential line are obtained, many important characteristics of the pair of differential lines have been obtained. For example, the SDD21 parameter reflects the insertion loss characteristic of the differential line, and the SDD11 parameter reflects its return loss characteristic.
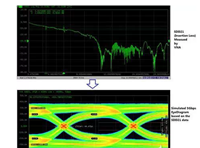
We can further obtain more information by performing inverse FFT transformation on these S parameters. For example, the SDD11 parameter transformation obtains the time domain reflection waveform (TDR: Time Domain Reflection), and the time domain reflection waveform can reflect the impedance variation of the measured transmission line. We can also inverse-FFT transform the SDD21 result of the transmission line to obtain its impulse response, so as to predict the waveform or eye diagram of the digital signal with different data rates after the pair of differential lines. This is very useful information for digital design engineers.
It can be seen that the vector network analyzer (VNA) is used to measure the transmission channel of the digital signal. On the one hand, the RF microwave analysis method is used, and the characteristics of the transmission channel can be obtained very accurately in the frequency range of several tens of GHz. On the one hand, by performing some simple time-domain transformation on the measurement results, we can analyze the impedance changes on the channel and the impact on the real signal transmission, so that digital engineers can judge the backplane, cable, and connectors, PCBs, etc. are good or bad, and you don't have to wait until the last signal goes wrong.